





The Problem
A few days ago I came across a post on Xiaohongshu titled “Selling Options for Stable Income?”
The post was short: friends of the author reportedly earned regular, stable income from options — some of them no longer needed their salaries and quit their jobs. “Is it really that good? Which stocks do you all trade? Any tax issues?”
The post had 100 comments.
I am in no position to laugh at it. Because for the past few months, I have been asking myself the same question — just in different words. I built an options cash-flow system, ran it for most of a year, watched the ledger grow thicker. And still, some late nights, a whisper: can this system really earn “stable income”?
So this time I stopped guessing and stopped listening to slogans. I gathered every piece of evidence I could find and put it all on the same trial table:
- Global evidence: academic papers, forty years of CBOE index records, third-party backtests, the full ledger of real products — and the most famous “autopsy files” of the past three decades;
- Human samples: the 100 comments under that post, top ones read line by line;
- Mechanism analysis: why it looks stable has to be taken apart at the mechanical level;
- My own ledger: 143 live options trades and 48 stock trades, audited one by one.
This article is the record of that trial. It may be the most important thing I have ever written — because it answers, not “how to make money with options,” but “are we actually built to live off it.”
The short version: Yes — but what is stable is not the cash flow; it is the system and the discipline. It behaves like an insurance business: regular income, irregular losses. The three switches — collateral, premium, management — must all be on. Miss one and everything earned earlier gets given back.
Layer One: Global Evidence — Do Sellers Really Have an Edge?
Start with the most fundamental question: as a group, are options sellers profitable over the long run?
The answer: Yes — with a long list of conditions attached.
First, academia. In 2003, Bakshi and Kapadia showed in the Review of Financial Studies that delta-hedged option portfolios systematically underperform the risk-free rate. In plain words: options, on average, are priced richer than they “should” be. The excess is called the volatility risk premium.
CBOE’s own numbers are even more intuitive: from 1990 to 2018, the average implied volatility on the S&P 500 was 19.3%, while realized volatility was only 15.1%. That four-point gap is what buyers pay extra for “insurance” — and it flows steadily into sellers’ pockets.
This is not mysticism. It is the mathematics of the insurance business. An insurer cannot profit on every policy, but premiums exceed payouts over time.
The Forty-Year Exam: The PUT Index
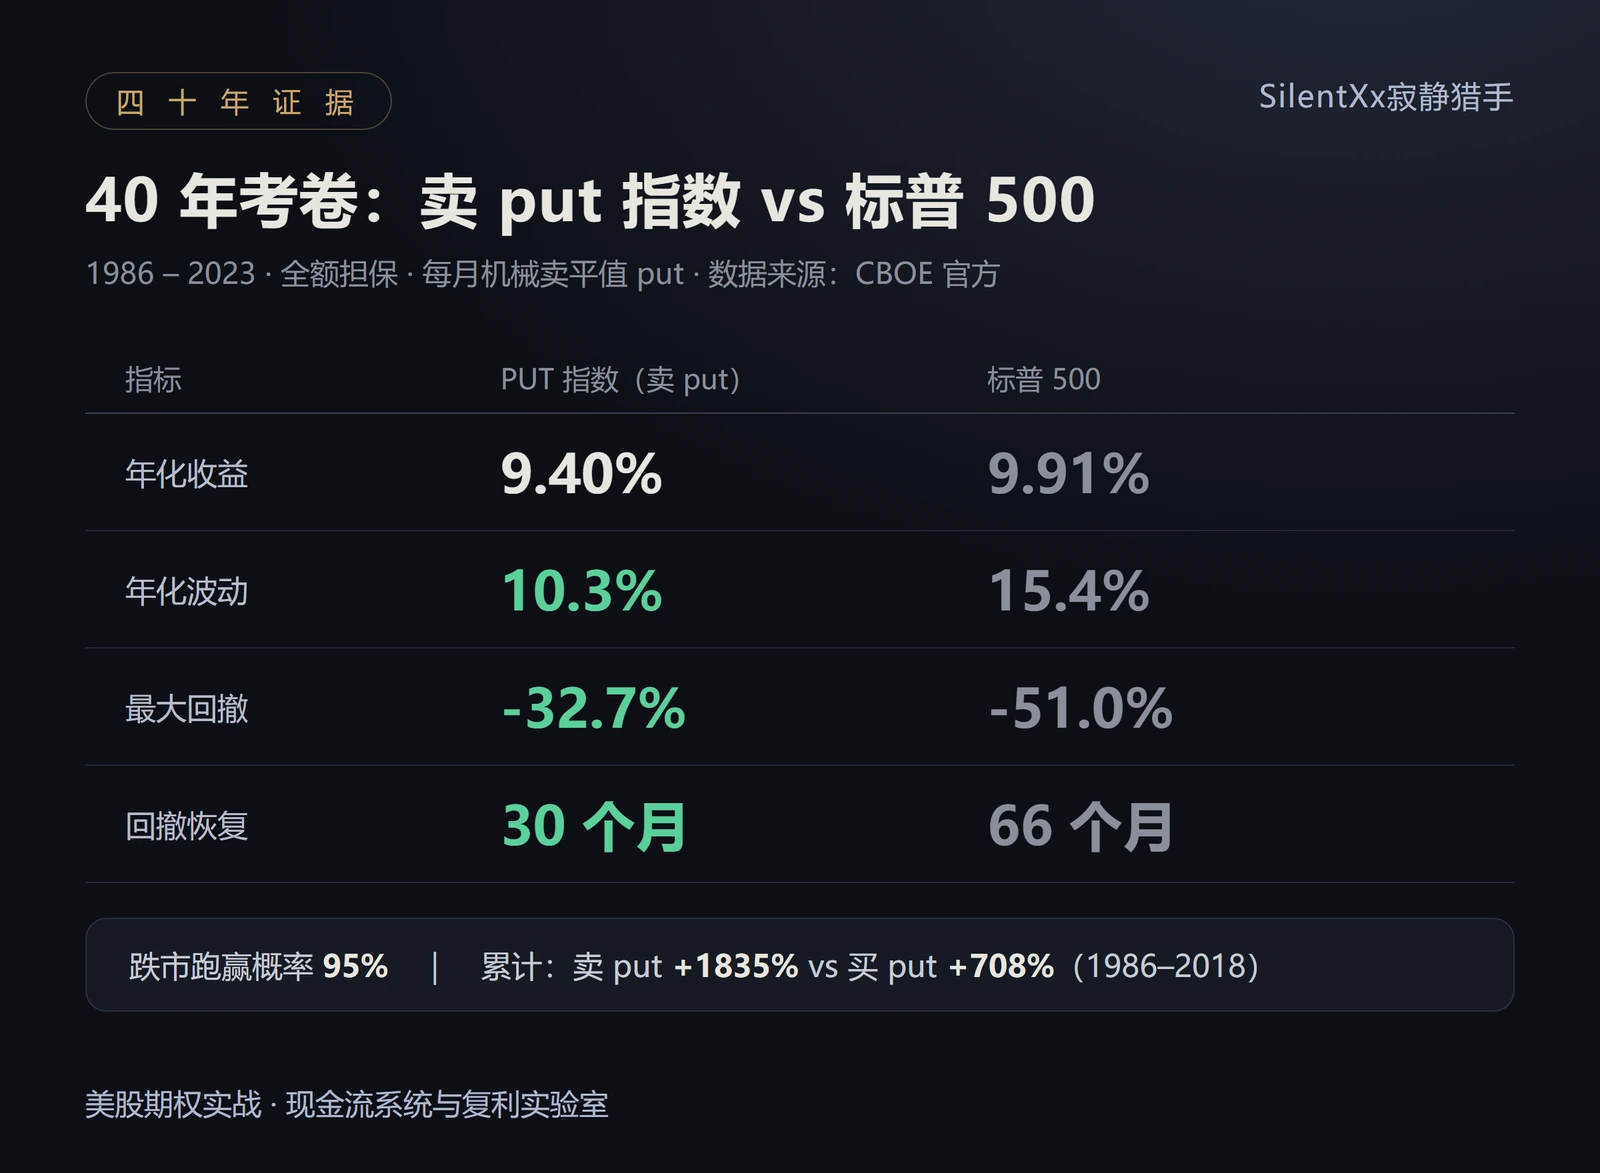
If you allow me only one piece of evidence, I choose this: the CBOE S&P 500 PutWrite Index (PUT). Since 1986 it has sold one at-the-money put every month, fully collateralized, mechanically executed, with zero human judgment.
Through August 2023, its report card:
| PUT Index (put selling) | S&P 500 | |
|---|---|---|
| Annualized return | 9.40% | 9.91% |
| Annualized volatility | 10.3% | 15.4% |
| Max drawdown | -32.7% | -51.0% |
| Drawdown recovery | 30 months | 66 months |
Same returns, about two-thirds of the risk. In years when the S&P fell, it outperformed 95% of the time.
There is a starker comparison: running the exact same index options monthly, the put-selling index compounded +1835% while the put-buying index compounded +708% (1986-2018). One market, mirrored operations — and the seller made more than twice as much as the buyer.
The price is written into the distribution: skewness -2.72, kurtosis 13 (a normal distribution is 0 and 3). In human terms: small wins most of the time, a big loss now and then. In 1987, 2008 and 2020 it took heavy beatings — but it never died. Because it is fully collateralized, nobody can ever force it to liquidate at the worst possible moment.
The Strategy Level and the Product Level
Forty years is too long for details. We checked two more layers.
Strategy level — a wheel backtest (2018-2025, covering the COVID crash and the 2022 bear market): 11.2% annualized, slightly behind buy-and-hold’s 12.8%. But max drawdown -18.4% versus -33.7%; in 2022, -2.1% versus -19.4%. In a bull market it structurally loses by 3-5 points a year; in choppy markets it leads by roughly 8%; bear markets are its home turf.
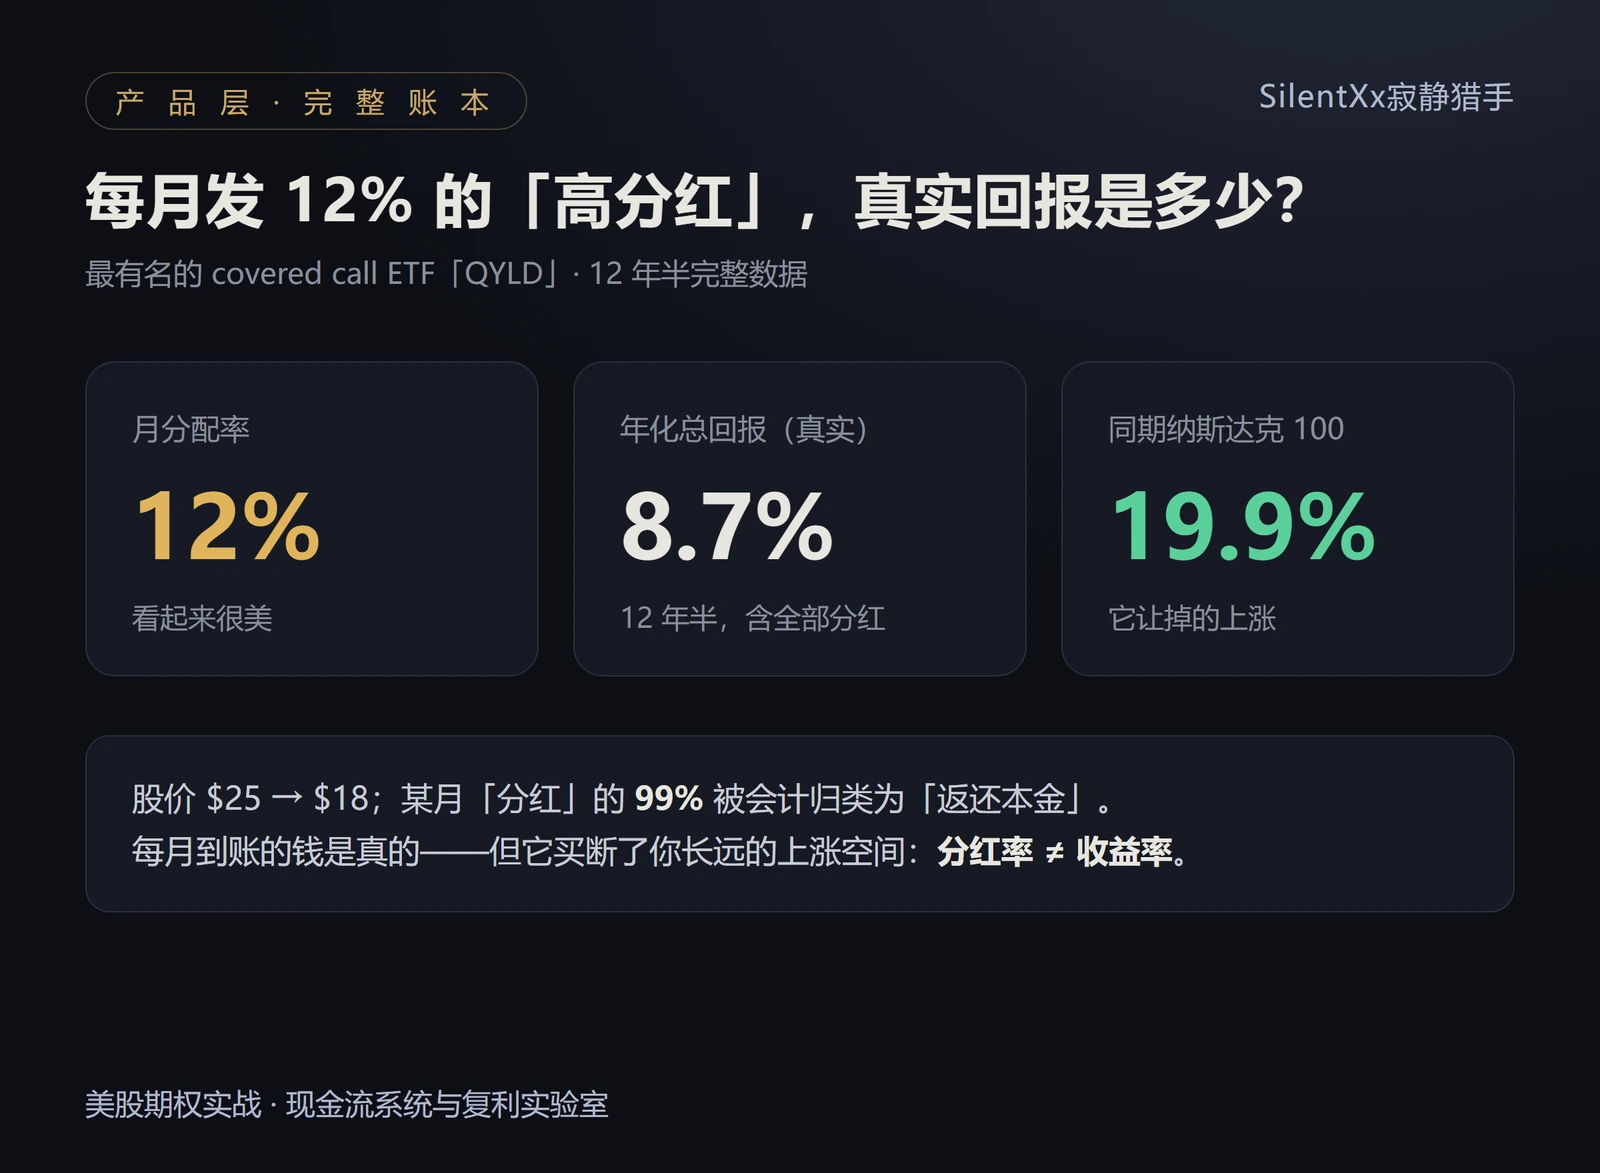
Product level — a real product’s complete ledger: The most famous covered call ETF, “QYLD,” pays a 12% distribution rate. Sounds gorgeous. But its 12.5-year record: 8.7% annualized total return, against 19.9% for the Nasdaq 100 it writes options on. Its share price drifted from $25 to $18 — and in one month, 99% of its “distribution” was classified as return of capital.
This is not a scam. It is the textbook case of distribution rate ≠ total return: the monthly cash is real, but it was bought with long-term upside.
When You Sell Matters More Than What You Sell
A 20-year study by tastytrade found the key condition: when IV Rank is above 30, selling options has positive expectancy at roughly a 3:1 reward-to-risk ratio; when IV Rank is below 20, expectancy turns negative. Selling insurance in calm markets is a losing business.
Backtests from institutional desks in China reach the same conclusion: the identical selling strategy returns -13% annualized when IV is at 10%, and +185% when IV is at 30%. There is exactly one engine: the gap between implied and realized volatility.
The Autopsy Files: Nobody Died from “Selling Options”
Now the scary part — isn’t selling options how accounts blow up? We opened decades of case files:
- OptionSellers.com (2018): Cordier, a man who wrote a book teaching option selling, had twenty “stable” years. Then natural gas spiked 18% in a day. Clients lost $150 million — and owed money on top. Cause of death: naked selling + no protection.
- The LJM “Preservation” Fund (2018): A fund with “preservation” in its name sold naked S&P puts with leverage. The VIX doubled from 17 to 37 in a day; two days later the fund was down 80%; $650 million evaporated. Cause of death: leverage.
- Karen “the Supertrader” (2015-16): A social-media star who publicly claimed 25-30% annualized — in reality she sold naked strangles with heavy leverage, rolled over $50 million-plus of losses for 18 months, and ended up with an SEC fraud complaint. Cause of death: leverage + hiding losses.
Three case files. Not one died from the act of selling options. All three died from the same thing: losing the power to choose at the exact moment it mattered most.

Layer Two: The 100 Comments — Real Humans
Back to the post. I read the top comments one by one. Three camps:
The doomsayers (holding the top-voted spots):
- “I’ve sold puts for years. Tax-wise it doesn’t pay, and the tail risk is real. I’m rethinking my approach.” — The most experienced voice in the thread was the most cautious.
- “Sell options long enough and within two or three years you’ll find it doesn’t really make money at all — you’d be better off just buying stocks.”
- “Clearly someone who’s never lived through a crash. You make small money for years, then one market shock gives it all back and worse.”
The hands-on traders (a minority, seriously posting):
- “My goal is $1,000 a week. I don’t have cash for shares, but I have tens of thousands in buying power, so taking on $100k-200k assignments should be safe enough.” — The author replied: “A thousand a week is already amazing.”
The bystanders: “How much income?” “Could you share more details?”
One comment was the sharpest, and it deserves an answer — “Can you beat the market?” Of 100 comments, nobody answered it directly.
And the most striking number of all: 100 comments, and zero about risk rules. No position sizing, no collateral structure, no drawdown limits. Everyone asked what to buy, what to sell, and how much they’d make.
That gap is the real distance between retail traders and the market.
Layer Three: The Mechanism — Why Does It Look Stable?
The illusion of stability deserves to be taken apart mechanically:
Premium is certain; profit is not. Every time you open a position, cash flow +1 immediately. But the real result is only revealed at close, expiry, or assignment. High-frequency small credits against low-frequency large debits — and the account curve looks “regular,” even stable.
The correct scorecard is:
Long-term net result = premiums + closing P&L − commissions − slippage − financing cost − taxes
Then look at max drawdown, recovery time, worst months — not at “how much premium I collected this month.”
One number to remember the difference: QYLD distributes at a 12% rate, and its real 12.5-year total return is 8.7%. The monthly joy fades the moment you look at total wealth.
Layer Four: My Own Ledger — 143 Trades on Trial
Evidence, comments, mechanics — all of it belongs to others. Time to open my own books.
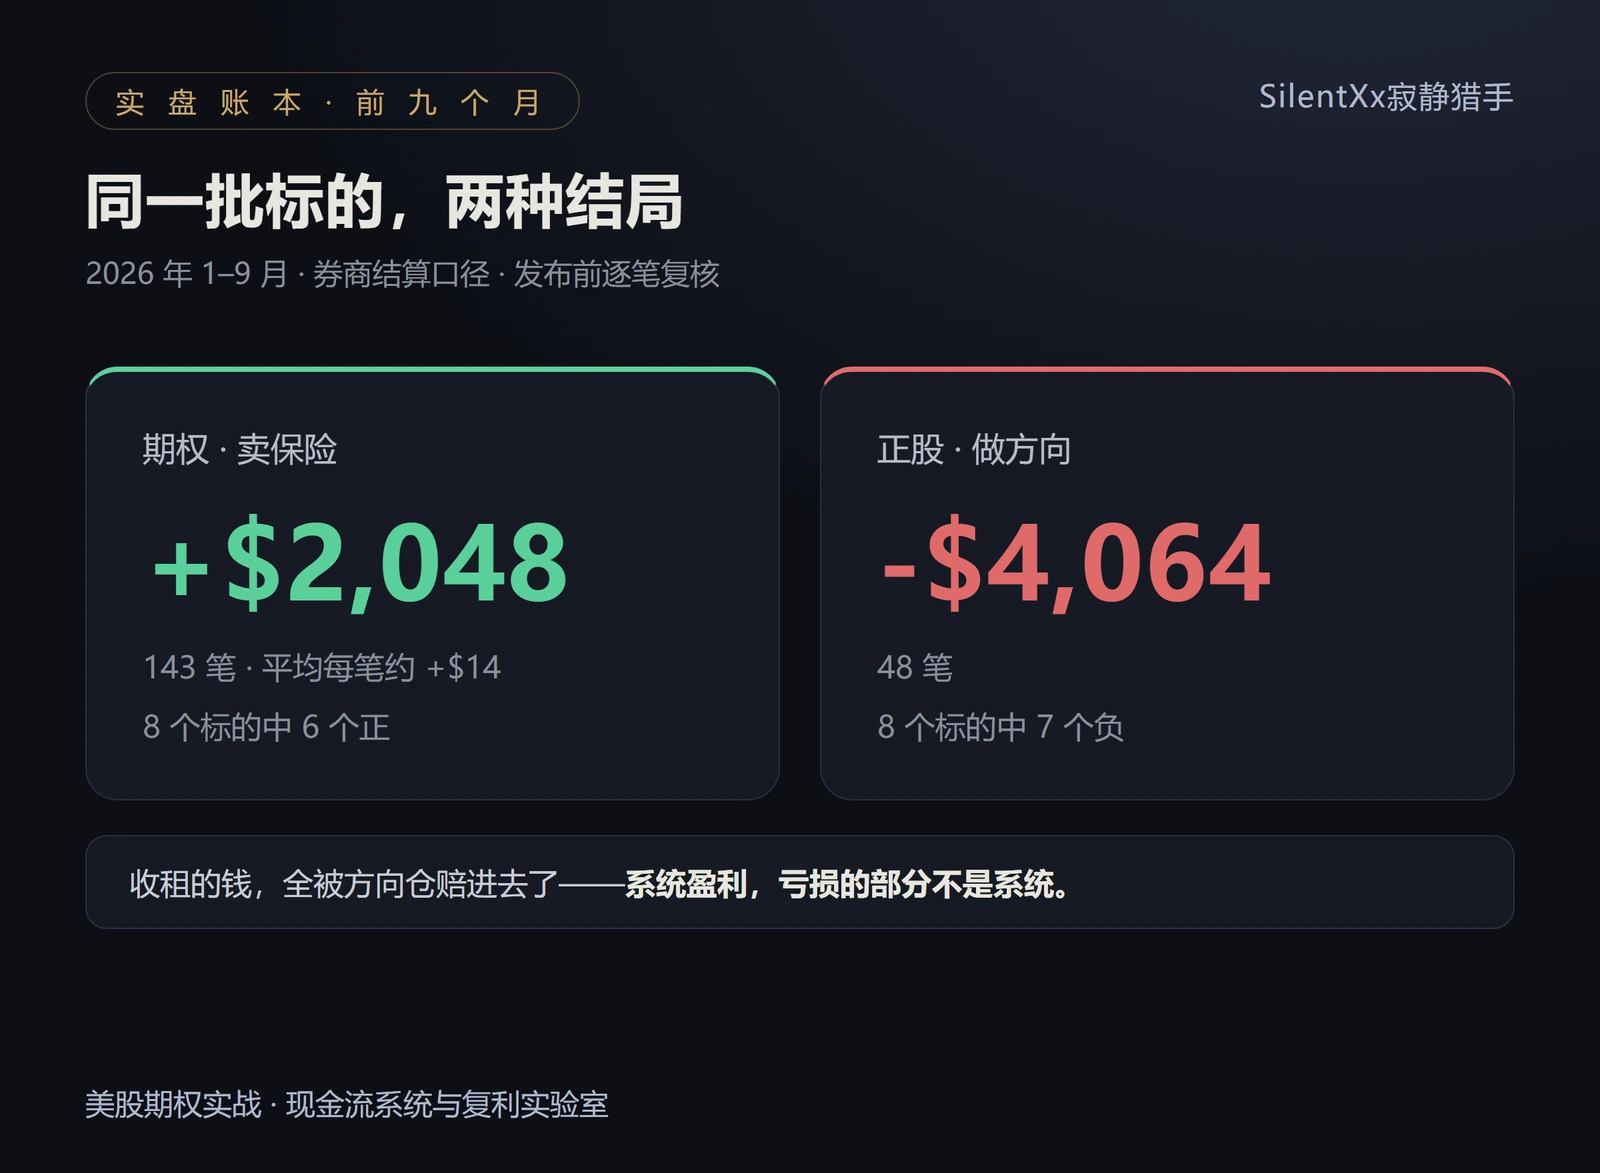
In the first nine months of this year, my options cash-flow engine ran 143 trades:
- Options: +$2,048 (averaging about +$14 per trade; six of eight tickers positive);
- Directional stock trades: -$4,064 (48 trades; seven of eight tickers negative).
Same tickers: the options made money, the stocks lost it. The rent collected was eaten by the “house purchases.”
This is not a strategy failing — it is the proof that the strategy works. The engine produces about +$228 a month, a machine with positive expectancy. What actually ate the profits were operations outside the engine: directional bets, leverage, and holding losers.
On the strictest basis (net liquidation value minus cumulative deposits): at the latest snapshot, five years of deposits total $10,989 against an account value of $9,891 (the September 30 snapshot) — $1,098 from being back in the green across all history. At the engine’s pace, that is four or five more months.
So when people ask “is the system even profitable?” — my own data answers: the system is profitable; what lost money was not the system.
The Verdict: Three Switches
Put the four layers together and the conclusion surfaces. It is not “yes” or “no.” It is three switches — all three on, or everything earned earlier gets given back:
Switch 1 · Collateral. Fully collateralized, no naked selling, no leverage to inflate your “salary.” Every blowup story died here; every surviving system passed here. My red lines: leverage ≤ 1.5x, hard stop 2.0x.
Switch 2 · Premium. Sell insurance only when volatility is expensive. When IV Rank is high and the volatility premium is thick, expectancy is positive; force-selling in calm markets is donating money. My gates: IV Rank ≥ 60, or VRP ≥ 1.15.
Switch 3 · Management. Management beats stock selection. What doubled results in the backtests was not which stock was chosen, but disciplines like “never sell a call below cost basis on a losing position.” Manage actively at 21 DTE, take profits at 60-70%, and treat assignment as an incident (exit within two days). Details decide survival.

And three footnotes:
“Can it beat the market?” — Depends on the scorecard: it loses to the bull (structurally, 3-5 points a year) and wins at drawdowns (outperforming in 95% of down years). If your benchmark is risk-adjusted return at equal drawdown, it wins. If you only compare who rises more, it loses by design.
“My friend quit his job.” — That is not evidence. Evidence is “my friend quit, then lived through a full bull-bear cycle and is still here.” The bar for quitting is not “this month’s premium ≈ my salary.” It is: capital large enough (a 30-50% drawdown does not change your life), a track record long enough (3-5 years, full cycle), and no bleeding outside the system.
“What does ‘stable’ even mean?” — What is stable is not the cash flow; it is the system and the discipline. Income is regular; losses are not. Small wins are the norm; big losses are mandatory questions on the exam. Every genuinely stable system ends up the same way: an edge in probability, plus a margin of survival.
Closing
As I write this, my account is $1,098 away from being green across all five years. Five years, one full loop of “tuition → transformation → verification” — enough, perhaps, to say a few true things.
The post’s question — “is it really that good?” — is best answered this way: No, it is not that good. But it can be solid. It will not make you rich overnight, and it will not ruin you overnight either (as long as you don’t sabotage yourself). It is closer to a small business you run with care: buy inventory (take risk), collect premiums (sell insurance), pay claims (accept big losses) — and outlive your competitors through discipline.
I have pinned the three switches from this study into my system: into my knowledge base, into my skill rules, and onto the screen I open every day.
A note to myself five years from now: You do not make money by predicting the market. You make money by living long enough.
Addendum (2026-10-13): Figures in this article have been re-verified against broker trade-level settlement records. Options: 121 trades / +$2,162 corrected to 143 trades / +$2,048; directional stock trades: 41 / -$2,875 corrected to 48 / -$4,064 (assignment and expiry records now included); five-year deposits $10,203 corrected to $10,989 (a September wire was booked late); the distance from all-time breakeven corrected from $312 to $1,098. The conclusion stands: the system is profitable; what lost money was not the system.
Sources and References
Sources and references (feel free to verify):
- Bakshi & Kapadia, Delta-Hedged Gains and the Negative Market Volatility Risk Premium, Review of Financial Studies, 2003 — paper
- Cboe, Generating Income and Managing Risk: Cash-Secured Put Writing (PUT Index 1986–2023) — cboe.com
- Cboe (Bondarenko), Historical Performance of Put-Writing Strategies (+1835% vs +708%) — cboe.com
- EnnisKnupp, Evaluating the Performance Characteristics of the Cboe S&P 500 PutWrite Index — PDF; Neuberger Berman, Simply PutWriting — PDF
- OptionsPilot, Wheel Strategy Backtesting Results — link; OptionsBrainiac, Wheel Backtest Research — link
- Are Covered-Call ETFs Like JEPI Worth It? (QYLD total return and return-of-capital) — link; The Options Bench, QYLD 12-year covered-call data — link
- tastylive, Selling Options Yields Consistent Success / The Expectancy of Trading Strangles (IV Rank evidence) — link
- Shenwan Hongyuan / Bohai Securities research on option-selling strategies (IV sensitivity and position control)
- CNBC / BBC / Forbes (2018, OptionSellers.com / Cordier); SteadyOptions (LJM); TheStreet and SEC filings (Karen Bruton, 2015)
- de Silva, Smith & So, Losing is Optional (retail option-buyer losses) — PDF
- Original Xiaohongshu post “Selling Options for Stable Income?” comment section, Sep 2026 (read line by line)
- This article’s personal ledger: IBKR trade-level settlement records, 2026-01-01 to 09-30, re-verified before publication
📮 The discussion thread for this article is on Tiger Community — Can an options cash-flow system really earn stable income?
Trading Insights #010 · To be continued